Installation
# install.packages("devtools")
devtools::install_github("csgroen/ggheatmapper")
Key Features
- Multi‑panel support via
patchwork: mix heatmaps, dendrograms, annotations and anyggplotorgrob - Supports semi-supervised hierarchical clustering (clustering within groups)
- Row-facetted heatmaps
- Raster for very-large heatmaps
-
ggtreeintegration for hierarchical tree sidebars -
tidyverse‑friendly API: works with tibbles and pipes … and more!
Hands-on example
ggheatmapper works with matrices:
library(ggheatmapper)

data(tcgaBLCA_ex)

head(tcgaBLCA_ex$gexp, 20) |>
    ggheatmap(center = TRUE,
              scale = TRUE,
              show_colnames = FALSE,
              colors_title = "Scaled exp")
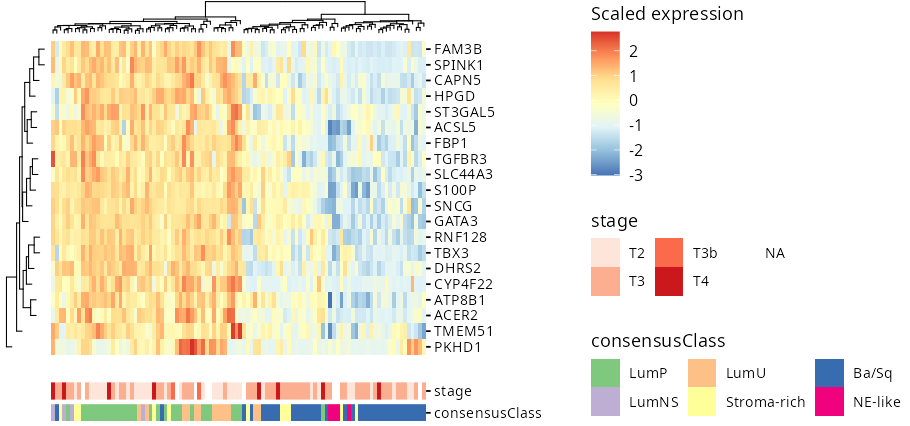
But shines with tidy data, where each column represents a variable and each row represents and observation.
When working with biological data (RNA-seq, single-cell, etc), often data is stored as genes x samples. But this makes it challenging to include other metadata available for samples. Here, I show how to manipulate data of this type to plot using ggheatmapper:
library(ggheatmapper)

data(tcgaBLCA_ex)

exp_mat <- head(tcgaBLCA_ex$gexp, 20)
sample_annot <- tcgaBLCA_ex$sample_annot

exp_mat |>
    t() |>
    as.data.frame() |>
    rownames_to_column("sample") |>
    left_join(sample_annot, by = "sample") |>
    ggheatmap(
        rowv = rownames(exp_mat),
        colv = "sample",
        scale = TRUE,
        center = TRUE,
        colors_title = "Scaled expression",
        show_colnames = FALSE) |>
    add_tracks(track_columns = c("stage", "consensusClass"), track_prop = 0.1,
               track_colors = list("stage" = "Reds", "consensusClass" = "Accent"))
Contributing
- Fork the repo
- Create your feature branch (git checkout -b feature/awesome-heatmap)
- Commit your changes (git commit -m “My new awesome feature”)
- Push to your fork and open a PR
Please file issues for bugs or requests